Strategy cost: the price of a mistake
See how every possible hold gets an exact expected-value score.
Every hold is a finite calculation
Five cards create 2⁵, or 32, possible holds: each card is either kept or discarded. For one hold, expected value is the average final payout over every legal way to replace the discards from the 47 unseen cards. Sharper Edge enumerates those outcomes rather than estimating them from a sample.
Hold EV is shown as credits returned per credit wagered. The original wager is the same whichever hold you choose, so comparing payout EVs ranks the decisions correctly. Two holds can tie exactly; when they do, both are optimal.
Strategy cost measures the gap between choices
A hand’s strategy cost is the best hold’s EV minus the EV of the hold you selected. Zero means you found an optimal play. A positive value is the average return surrendered by that decision, before the random replacement cards are known.
This is an expected cost, not a fee removed from the balance. A costly mistake may hit a jackpot; an optimal hold may return nothing. The random result does not change the value of the decision at the moment it was made.
A worked example
You are dealt Q♠ Q♥ J♠ 10♠ 9♠ in 9/6 Jacks or Better. The pair of queens is already a paying hand. The stronger choice is Q♠ J♠ 10♠ 9♠: it can become a straight flush, an ordinary flush, a straight, or several smaller paying hands.
The best hold keeps four spades and discards Q♥. K♠ and 8♠ make a straight flush; the other seven remaining spades make a flush.
The exact gap is about 2.102 credits per credit wagered, or 10.51 expected credits at this trainer’s five-credit bet.
The queens are not irrational; they average 1.537 credits back per credit. They are expensive only in comparison with the unusually strong four-card draw. Many important mistakes look reasonable until both candidates are scored.
The severity scale prioritizes mistakes
The trainer groups exact per-credit EV gaps into five levels. These are teaching priorities, not universal industry labels. Color is always paired with an icon and text.
| Severity | EV lost per credit | How to use it |
|---|---|---|
| Optimal | 0 cr | The best possible hold, including an exact tie. |
| Near-optimal | > 0 and < 0.01 cr | A tiny but exact gap; lower practice priority. |
| Minor error | 0.01 to < 0.05 cr | A small leak worth revisiting after larger errors. |
| Meaningful error | 0.05 to < 0.25 cr | A decision pattern with material repeated cost. |
| Major error | ≥ 0.25 cr | The largest gaps; study these conflicts first. |
Separate the decision from the cards
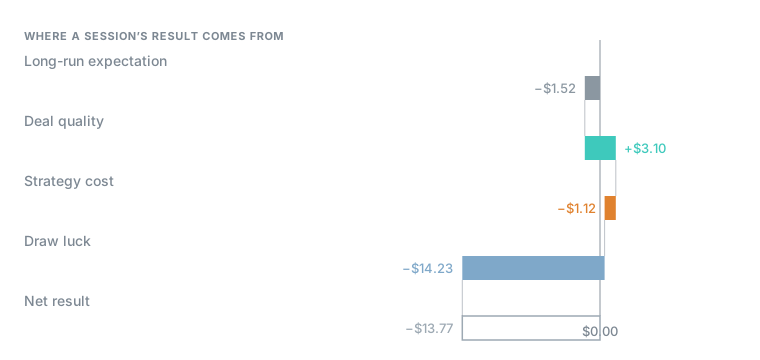
At the end of a session, Sharper Edge splits the net result into four parts. Long-run expectation is the pay table’s baseline. Deal quality measures whether the initial five cards offered better or worse opportunities than average. Strategy cost measures what the holds gave up. Draw luck is the difference between the chosen holds’ expected payout and what the replacements actually paid.
Try it at the table
Use 9/6 Jacks or Better with 'Warn before I draw.' The trainer stops on a suboptimal hold so you can inspect the EV gap before seeing the random result.